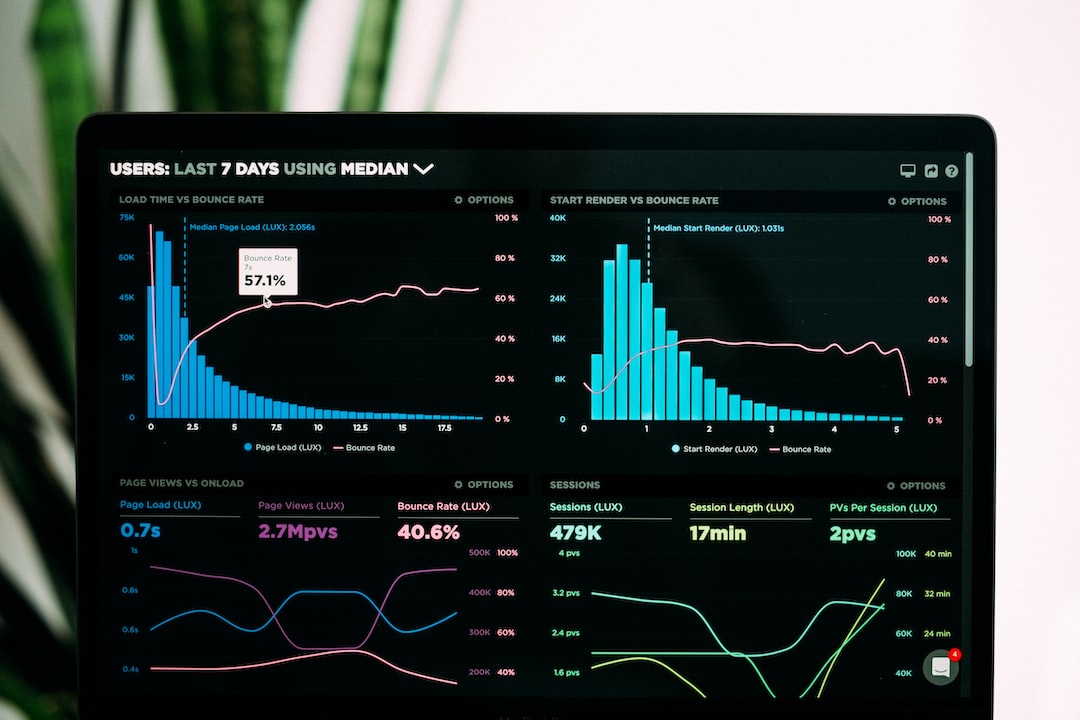
Data visualization is an essential aspect of any data-driven project. It helps to present complex data in a more understandable format, enabling you to extract valuable insights and make informed decisions. But creating engaging and interactive visualizations can be a daunting task, especially for those without a technical background.
Thankfully, there are several powerful libraries available that make it easy to create stunning visualizations without needing to know much about coding. In this blog post, we’ll explore some of the most popular libraries for data visualization and their unique features. Whether you’re a beginner or an expert, these libraries can help you create visually compelling data visualizations that will captivate your audience.
So, let’s dive in and take a closer look at these libraries!
D3.js – A Popular Library for Creating Interactive and Dynamic Data Visualizations

When it comes to data visualization libraries, D3.js stands out as one of the most popular and powerful tools available to developers. D3.js, short for Data-Driven Documents, is a JavaScript library that allows you to create interactive and dynamic data visualizations for the web.
What sets D3.js apart from other libraries is its ability to manipulate the Document Object Model (DOM) based on data. This means that you can link your data to the visual elements of your website, allowing for more dynamic and responsive visualizations.
D3.js supports a wide range of data formats, including JSON, CSV, and TSV, as well as a variety of visualizations, including bar charts, line graphs, and scatter plots. With D3.js, you can create complex visualizations that include animations, transitions, and interactivity.
One of the benefits of using D3.js is its broad community support. With a large and active community of developers, there are countless resources available online for learning and troubleshooting D3.js code. Additionally, the library is constantly evolving, with updates and new features regularly released by the development team.
While D3.js can be challenging to learn, especially for those new to JavaScript or data visualization, the benefits of mastering this library are well worth the effort. With D3.js, you can create highly customizable, dynamic, and interactive data visualizations that are sure to impress.
Additionally, the library is constantly evolving, with updates and new features regularly released by the development team.
Chart.js – A Simple and Flexible Library for Data Visualization

If you are a data enthusiast, you must have heard about Chart.js. This library is a simple and flexible tool that allows you to create stunning charts with ease. It is one of the most popular JavaScript libraries for data visualization and is widely used by developers across the world. With Chart.js, you can create a variety of chart types, including line, bar, pie, radar, and more. The library is highly customizable, making it an ideal choice for creating interactive and dynamic visualizations.
Chart.js is built on top of HTML5 canvas, which makes it lightweight and fast. It has an intuitive and easy-to-use API that allows you to create charts with just a few lines of code. You can customize the appearance of the charts to match your branding using CSS, and you can add tooltips, legends, and labels to make your charts more informative.
One of the best things about Chart.js is its flexibility. It can be used with different JavaScript frameworks, including React, Vue, and Angular. This means that you can use it in your existing projects without any hassle. Chart.js is also compatible with most modern browsers, including Chrome, Firefox, Safari, and Edge. This makes it an ideal choice for creating cross-platform visualizations.
Chart.js is an open-source library, which means that it is free to use and modify. It has an active community of developers who contribute to the library, making it more robust and reliable. You can find plenty of examples, tutorials, and documentation online to help you get started with Chart.js.
Chart.js is a simple and flexible library that supports a variety of chart types. It is highly customizable, making it an ideal choice for creating interactive and dynamic visualizations. Chart.js is also flexible and can be used with different JavaScript frameworks and is compatible with most modern browsers. If you are looking for a lightweight and versatile library for data visualization, Chart.js is definitely worth exploring.
You can customize the appearance of the charts to match your branding using CSS, and you can add tooltips, legends, and labels to make your charts more informative.
Plotly.js – A Comprehensive Library for Interactive Visualizations

When it comes to creating interactive data visualizations, Plotly.js is one of the most comprehensive libraries available. Not only does it support a wide range of chart types, but it also allows for the creation of 3D plots and maps.
One of the standout features of Plotly.js is its ability to handle large datasets with ease. The library is optimized for performance, meaning that even with thousands of data points, your visualizations will load quickly and smoothly.
Plotly.js offers a variety of chart types, including bar charts, line charts, scatter plots, and many more. In addition to traditional 2D charts, the library also supports 3D plots, which can be rotated and zoomed in real-time. This makes it ideal for creating visualizations of complex datasets, as it allows for a more immersive and detailed viewing experience.
Another impressive feature of Plotly.js is its support for maps. With the library, you can create interactive maps with customizable markers and popups. This can be incredibly useful for a wide range of applications, from tracking the spread of a disease to visualizing the distribution of a product across different regions.
Despite its many features, Plotly.js is also incredibly easy to use. The library comes with extensive documentation and examples, making it accessible even to beginners. Additionally, it can be integrated with a wide range of programming languages, including Python, R, and MATLAB.
Overall, if you’re looking for a powerful and flexible library for creating interactive visualizations, Plotly.js is definitely worth checking out. Its comprehensive features, ease of use, and support for large datasets make it a valuable tool for anyone working with data.
Plotly.
Three.js – Exploring the Power of 3D Visualizations and Animations

When it comes to data visualization, incorporating 3D graphics can add a whole new level of depth and immersion to your project. And that’s where Three.js comes in. This powerful library allows developers to easily create stunning 3D visualizations and animations that can bring data to life in ways that 2D graphics simply can’t.
But what makes Three.js stand out from other 3D libraries? For starters, it’s incredibly adaptable. With a wide range of built-in tools and features, developers can create everything from basic 3D shapes to complex animations and interactive environments.
And speaking of interactivity, Three.js makes it easy to incorporate user input into your visualizations. Whether you want to allow users to manipulate 3D models or navigate through a virtual environment, this library has you covered.
But what about performance? After all, rendering 3D graphics can be resource-intensive. Fortunately, Three.js is optimized for speed and efficiency, allowing for smooth and seamless animations even on lower-end devices.
Of course, as with any library, there’s a bit of a learning curve when it comes to using Three.js. But the good news is that there’s a wealth of resources available to help developers get up to speed. From official documentation to online tutorials and forums, there are plenty of ways to learn the ins and outs of this powerful library.
So if you’re looking to take your data visualization to the next level, consider giving Three.js a try. With its versatility, interactivity, and performance, it’s a great choice for creating stunning 3D visualizations and animations that are sure to captivate your audience.
js.
Leaflet.js – A Lightweight Library for Creating Interactive Maps with Customizable Markers and Popups

Leaflet.js is a lightweight open-source JavaScript library that allows you to create interactive maps with customizable markers and popups. The library was developed by Vladimir Agafonkin in 2010 and has since become one of the most popular mapping libraries on the web.
One of the most significant advantages of Leaflet.js is its simplicity. The library is incredibly lightweight, weighing in at just 38 KB, making it quick and easy to integrate into your web application. Additionally, Leaflet.js works seamlessly on both desktop and mobile devices and is compatible with all major browsers.
Leaflet.js provides a range of mapping options, including custom markers, popups, and overlays, making it an ideal choice for creating dynamic and interactive maps. You can add images, videos, and other multimedia elements to your maps, making them more engaging and informative. The library also supports various tile providers, including OpenStreetMap, Mapbox, and Google Maps, allowing you to create maps with different styles and data sources.
Another useful feature of Leaflet.js is its extensive documentation and vibrant community of developers. The library has a well-organized and comprehensive documentation site that provides detailed information on all the features and functionalities. Additionally, there are numerous resources and tutorials available online that can help beginners get started with Leaflet.js.
Leaflet.js is an excellent choice for creating interactive maps with customizable markers and popups. Its simplicity, flexibility, and compatibility with mobile devices and browsers make it a top choice among developers. With its extensive documentation and active community support, Leaflet.js is accessible to anyone looking to create engaging and informative maps. So why not explore Leaflet.js for your next data visualization project and see how it can take your mapping to the next level?
js.
Conclusion: Exploring the Best Libraries for Dynamic Data Visualization
After exploring the top five libraries for dynamic data visualization – D3.js, Chart.js, Plotly.js, Three.js, and Leaflet.js – it’s clear that each one offers its own unique strengths and capabilities.
D3.js is undoubtedly the most popular and robust library out there, with a huge community and endless possibilities for customization. Chart.js, on the other hand, is a simpler library that can get the job done quickly and easily. Plotly.js, with its 3D plotting and mapping capabilities, is perfect for those who want to create highly interactive and immersive visualizations. Three.js is a powerful tool for anyone looking to create complex 3D visualizations and animations. Finally, Leaflet.js is a lightweight and customizable library for creating interactive maps with unique markers and popups.
As a data visualization enthusiast, it’s important to have a toolbox of libraries at your disposal. Each library has its own benefits and drawbacks, so it’s important to choose the right one based on your project’s specific needs. With the help of these five libraries, the possibilities for dynamic and interactive data visualization are endless.
So, we encourage you to explore these libraries for your own data visualization projects. Dive in and experiment with different chart types, visual styles, and customizations. Don’t be afraid to push the boundaries and try something new. With the right library and a little creativity, you can create stunning and informative visualizations that will captivate your audience and bring your data to life.
Happy visualizing!