Welcome to our blog post on the essential topic of debugging in coding! Debugging is a crucial skill for any programmer, as it involves identifying and fixing errors in our code to ensure that it runs smoothly and efficiently. Whether you are a beginner just starting out in the world of programming or a seasoned developer looking to enhance your skills, mastering the art of debugging is key to writing high-quality code.
In this post, we will explore the importance of debugging in coding, discuss the types of common code errors that programmers encounter, delve into various tools and techniques for effective debugging, provide visual examples of debugging in action, share best practices for preventing code errors, and conclude with a recap of key points. So, let’s dive in and unravel the mysteries of debugging together!
The Importance of Debugging in Coding

When it comes to coding, debugging is an essential process that cannot be overlooked. Debugging involves identifying and fixing errors or bugs in the code to ensure that the software functions as intended. Without proper debugging, even the most well-written code can fail to produce the desired results.
Debugging is crucial for several reasons. Firstly, it helps developers identify and rectify errors in the code, ensuring that the software functions correctly. This is crucial for maintaining the integrity of the software and delivering a high-quality product to end-users.
Furthermore, debugging can help improve the overall efficiency of the development process. By identifying and fixing errors early on, developers can streamline the development process and avoid costly delays down the line. Additionally, debugging can help developers gain a deeper understanding of the codebase, leading to more efficient and effective coding practices in the future.
In short, debugging is a fundamental aspect of coding that plays a crucial role in ensuring the success of software development projects. By prioritizing debugging and adopting best practices, developers can build more robust and reliable software that meets the needs of users.
Furthermore, debugging can help improve the overall efficiency of the development process.
Types of Common Code Errors

When it comes to coding, errors are inevitable. Even the most experienced programmers encounter bugs in their code from time to time. Understanding the types of common code errors can help you become a more effective debugger and improve the overall quality of your code.
1. Syntax Errors
Syntax errors are perhaps the most common type of error that programmers encounter. These errors occur when the code does not follow the rules of the programming language. This can include missing brackets, semicolons, or parentheses, as well as misspelled keywords or variable names. Syntax errors are usually easy to spot as they often result in error messages from the compiler or interpreter.
2. Logic Errors
Logic errors are errors that occur when the code does not produce the expected output due to a flaw in the logic of the program. These errors can be more challenging to identify as they do not necessarily result in error messages. Instead, the program may run without crashing but produce incorrect results. To debug logic errors, it is important to carefully review the code and check for any flaws in the underlying logic.
3. Runtime Errors
Runtime errors occur when a program is running and encounters an unexpected condition that causes it to crash or behave unexpectedly. Common examples of runtime errors include division by zero, null pointer exceptions, and stack overflow. Debugging runtime errors often involves using tools like a debugger to step through the code and identify the source of the issue.
4. Semantic Errors
Semantic errors are errors that occur when the code is technically correct but does not produce the desired outcome. These errors can be tricky to spot as the code will compile and run without any error messages. To identify semantic errors, it is important to closely examine the code and understand the intended behavior of the program.
By familiarizing yourself with the types of common code errors, you can become a more effective debugger and improve the quality of your code. Remember, debugging is a skill that takes time and practice to master, so don’t get discouraged if you encounter errors along the way.
Syntax errors are usually easy to spot as they often result in error messages from the compiler or interpreter.
Tools and Techniques for Effective Debugging

Debugging is a critical skill for any coder, as it involves identifying and fixing errors in your code to ensure it runs smoothly. Fortunately, there are a plethora of tools and techniques available to help streamline the debugging process and make your coding experience more efficient.
1. Integrated Development Environments (IDEs)
IDEs are software applications that provide comprehensive facilities for software development, including debugging tools. IDEs such as Visual Studio, IntelliJ IDEA, and Eclipse offer features like breakpoints, step-through debugging, and variable inspection, making it easier to identify and fix errors in your code.
2. Code Linters
Code linters are tools that analyze your code for potential errors, style issues, and best practices violations. By running a code linter on your codebase, you can catch common mistakes early on and ensure your code adheres to coding standards, ultimately reducing the likelihood of bugs.
3. Version Control Systems
Version control systems like Git allow you to track changes to your codebase, collaborate with other developers, and revert to previous versions if needed. By using version control effectively, you can pinpoint when and where bugs were introduced, making it easier to diagnose and fix them.
4. Debugging Techniques
When it comes to debugging, there are several techniques you can employ to identify and resolve errors in your code. Some common debugging techniques include:
- Setting breakpoints to pause execution at specific points in your code
- Using logging statements to print out diagnostic information
- Stepping through your code line by line to trace the flow of execution
- Inspecting variables to check their values at different points in your program
By mastering these debugging techniques, you can effectively isolate and fix bugs in your code.
5. Online Debugging Tools
There are a variety of online debugging tools available that can help you troubleshoot issues in your code. Tools like JSFiddle, CodePen, and JSBin allow you to run and debug code snippets in real-time, making it easier to test and diagnose problems in your code.
By leveraging these tools and techniques, you can become a more effective debugger and improve the quality of your code. Remember, debugging is a skill that takes practice, so don’t be discouraged if you encounter challenging bugs – keep experimenting, learning, and refining your approach to debugging.
Fortunately, there are a plethora of tools and techniques available to help streamline the debugging process and make your coding experience more efficient.
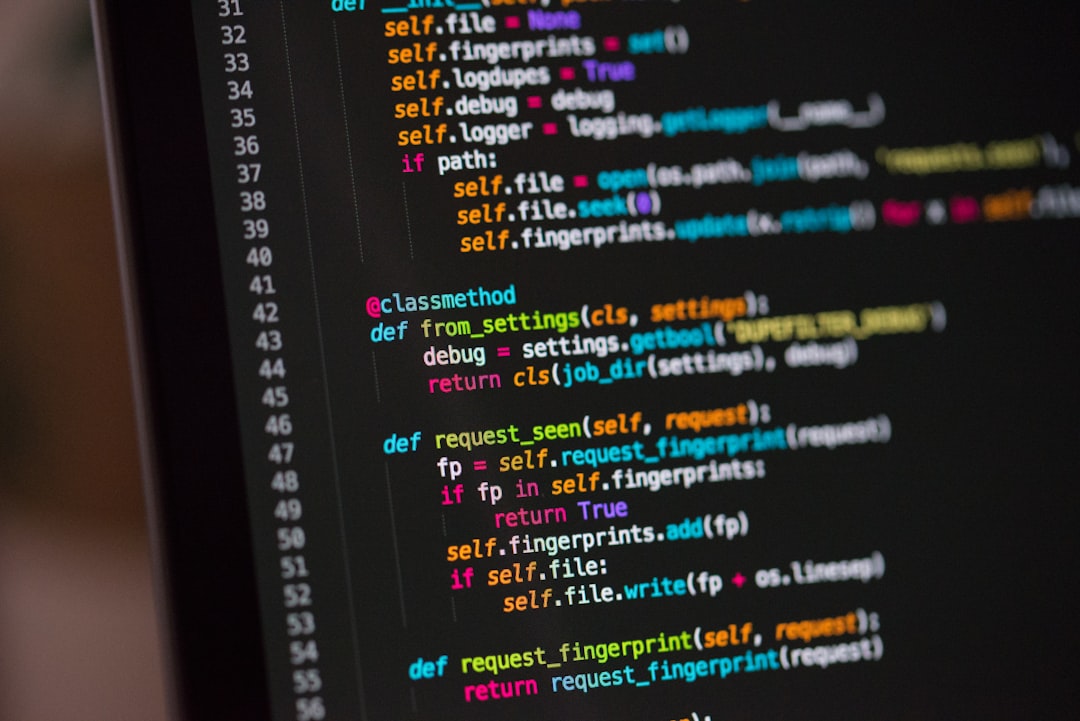
Visual Examples of Debugging in Action

When it comes to debugging in coding, sometimes seeing is believing. Visual examples can provide a clear demonstration of how the process works and the impact it can have on improving the functionality of your code. Let’s take a look at a few scenarios where debugging can make a significant difference:
1. **Syntax Errors**: One common example of debugging in action is fixing syntax errors. These errors occur when there is a mistake in the structure of the code, such as missing parentheses or semicolons. By using a debugger tool, you can identify the exact line where the error is occurring and make the necessary corrections.
2. **Logic Errors**: Another visual example of debugging is addressing logic errors. These errors occur when the code does not produce the expected output due to a flaw in the algorithm or conditional statements. With debugging tools, you can step through the code line by line, inspecting variables and values to pinpoint the issue and make adjustments accordingly.
3. **Runtime Errors**: Runtime errors can also be effectively debugged using visual examples. These errors occur when the code encounters a problem while running, such as dividing by zero or accessing an out-of-bounds array index. By utilizing debugging techniques like setting breakpoints and watching variables, you can track the execution of the code and identify the source of the runtime error.
4. **Interactive Debugging**: Visual examples can also showcase the power of interactive debugging, where you can pause the execution of the code at specific points to inspect variables, evaluate expressions, and make changes on the fly. This hands-on approach to debugging allows you to actively troubleshoot issues and test potential solutions in real-time.
Overall, visual examples of debugging in action can help demystify the process and highlight the importance of thorough problem-solving techniques in coding. By seeing how errors are identified and resolved visually, you can gain a better understanding of the debugging process and improve your skills in troubleshooting code effectively.
These errors occur when there is a mistake in the structure of the code, such as missing parentheses or semicolons.
Best Practices for Preventing Code Errors

Preventing code errors is essential for maintaining the overall functionality and efficiency of your codebase. By following best practices, you can reduce the likelihood of encountering bugs and ensure smoother development and deployment processes. Here are some key practices to keep in mind:
- Code Reviews: Regular code reviews by peers or team members can help catch errors early on and ensure that best practices are being followed. This collaborative approach can lead to higher quality code and fewer bugs in the long run.
- Testing: Writing comprehensive unit tests and integration tests can help identify bugs before they make their way into production. Automated testing tools can also be used to streamline the testing process and catch errors more efficiently.
- Documentation: Maintaining thorough documentation for your codebase, including comments within the code itself, can help other developers understand the logic behind your code and spot potential errors more easily. Clear documentation can also aid in troubleshooting and debugging efforts.
- Version Control: Utilizing version control systems like Git can help track changes to your codebase over time and revert to previous versions if necessary. This can prevent errors from being introduced when making changes to the code.
- Code Standards: Following coding standards and best practices, such as naming conventions, code formatting, and design patterns, can help maintain consistency in your codebase and reduce the likelihood of errors caused by inconsistent coding styles.
- Refactoring: Regularly refactoring your code to improve its readability, maintainability, and performance can help prevent errors from accumulating over time. By continuously optimizing your code, you can reduce the risk of encountering bugs in the future.
By incorporating these best practices into your development workflow, you can proactively prevent code errors and ensure a more stable and reliable codebase. Remember, prevention is always better than cure when it comes to coding!
This can prevent errors from being introduced when making changes to the code.
Conclusion and Recap of Key Points
As we wrap up this discussion on debugging in coding, it’s important to reiterate the significance of this process in the development cycle. Debugging plays a crucial role in ensuring that our code functions as intended, identifying and fixing errors that may otherwise lead to issues down the line.
We have explored the various types of common code errors that developers encounter, from syntax errors to logic errors, and discussed the tools and techniques available for effective debugging. By leveraging debugging tools such as breakpoints, console logging, and integrated development environments, developers can streamline the debugging process and quickly pinpoint errors in their code.
Furthermore, we have examined visual examples of debugging in action, highlighting the step-by-step process of identifying and resolving errors in code. By visually seeing how debugging techniques are applied in real-world scenarios, developers can better understand how to tackle similar issues in their own projects.
In addition, we have discussed best practices for preventing code errors, emphasizing the importance of writing clean, well-documented code, testing regularly, and seeking feedback from peers. These practices can help developers proactively address potential errors before they escalate into larger issues.
As you continue on your coding journey, remember that debugging is a skill that can be honed over time. By staying vigilant, remaining adaptable, and approaching debugging with a systematic mindset, you can become a more efficient and effective developer.
In conclusion, debugging is not just about fixing errors in code; it’s about fostering a mindset of continuous improvement and problem-solving. Embrace the challenges that debugging presents, and use them as opportunities to grow and enhance your coding skills. Happy debugging!